Receive first-hand news on the latest bond issues, credit updates and special events when you join us on our Telegram channel at https://t.me/bondsupermart!
- OCBC reported a 20% YoY increase in total income, supported by record high net interest income in FY23. Net profit also hit a record S$ 7,021M, growing 27% YoY in the same period.
- We remain positive on OCBC’s earnings outlook and expect net interest margin to remain elevated as well as faster growth in ASEAN and Greater China region.
- Credit profile remains healthy as OCBC is well-capitalised, with resilient asset quality, strong liquidity, and a stable funding base.
OCBC was established in 1932 and is ranked Southeast Asia's second-largest financial services group by assets. The Group is also identified as one of the domestic systematically important banks (“D-SIBs”) by the MAS. OCBC’s key markets include Singapore, Malaysia, Indonesia, and Greater China, with more than 400 branches and offices established across these areas. OCBC reports operations in three main groups 1) Global Consumer/Private Banking, 2) Global Wholesale Banking, 3) Global Markets and 4) Insurance.
The group currently has an issuer rating of Aa1/AA-/AA- by Moody’s/S&P/Fitch.
FY23 Financial Highlights
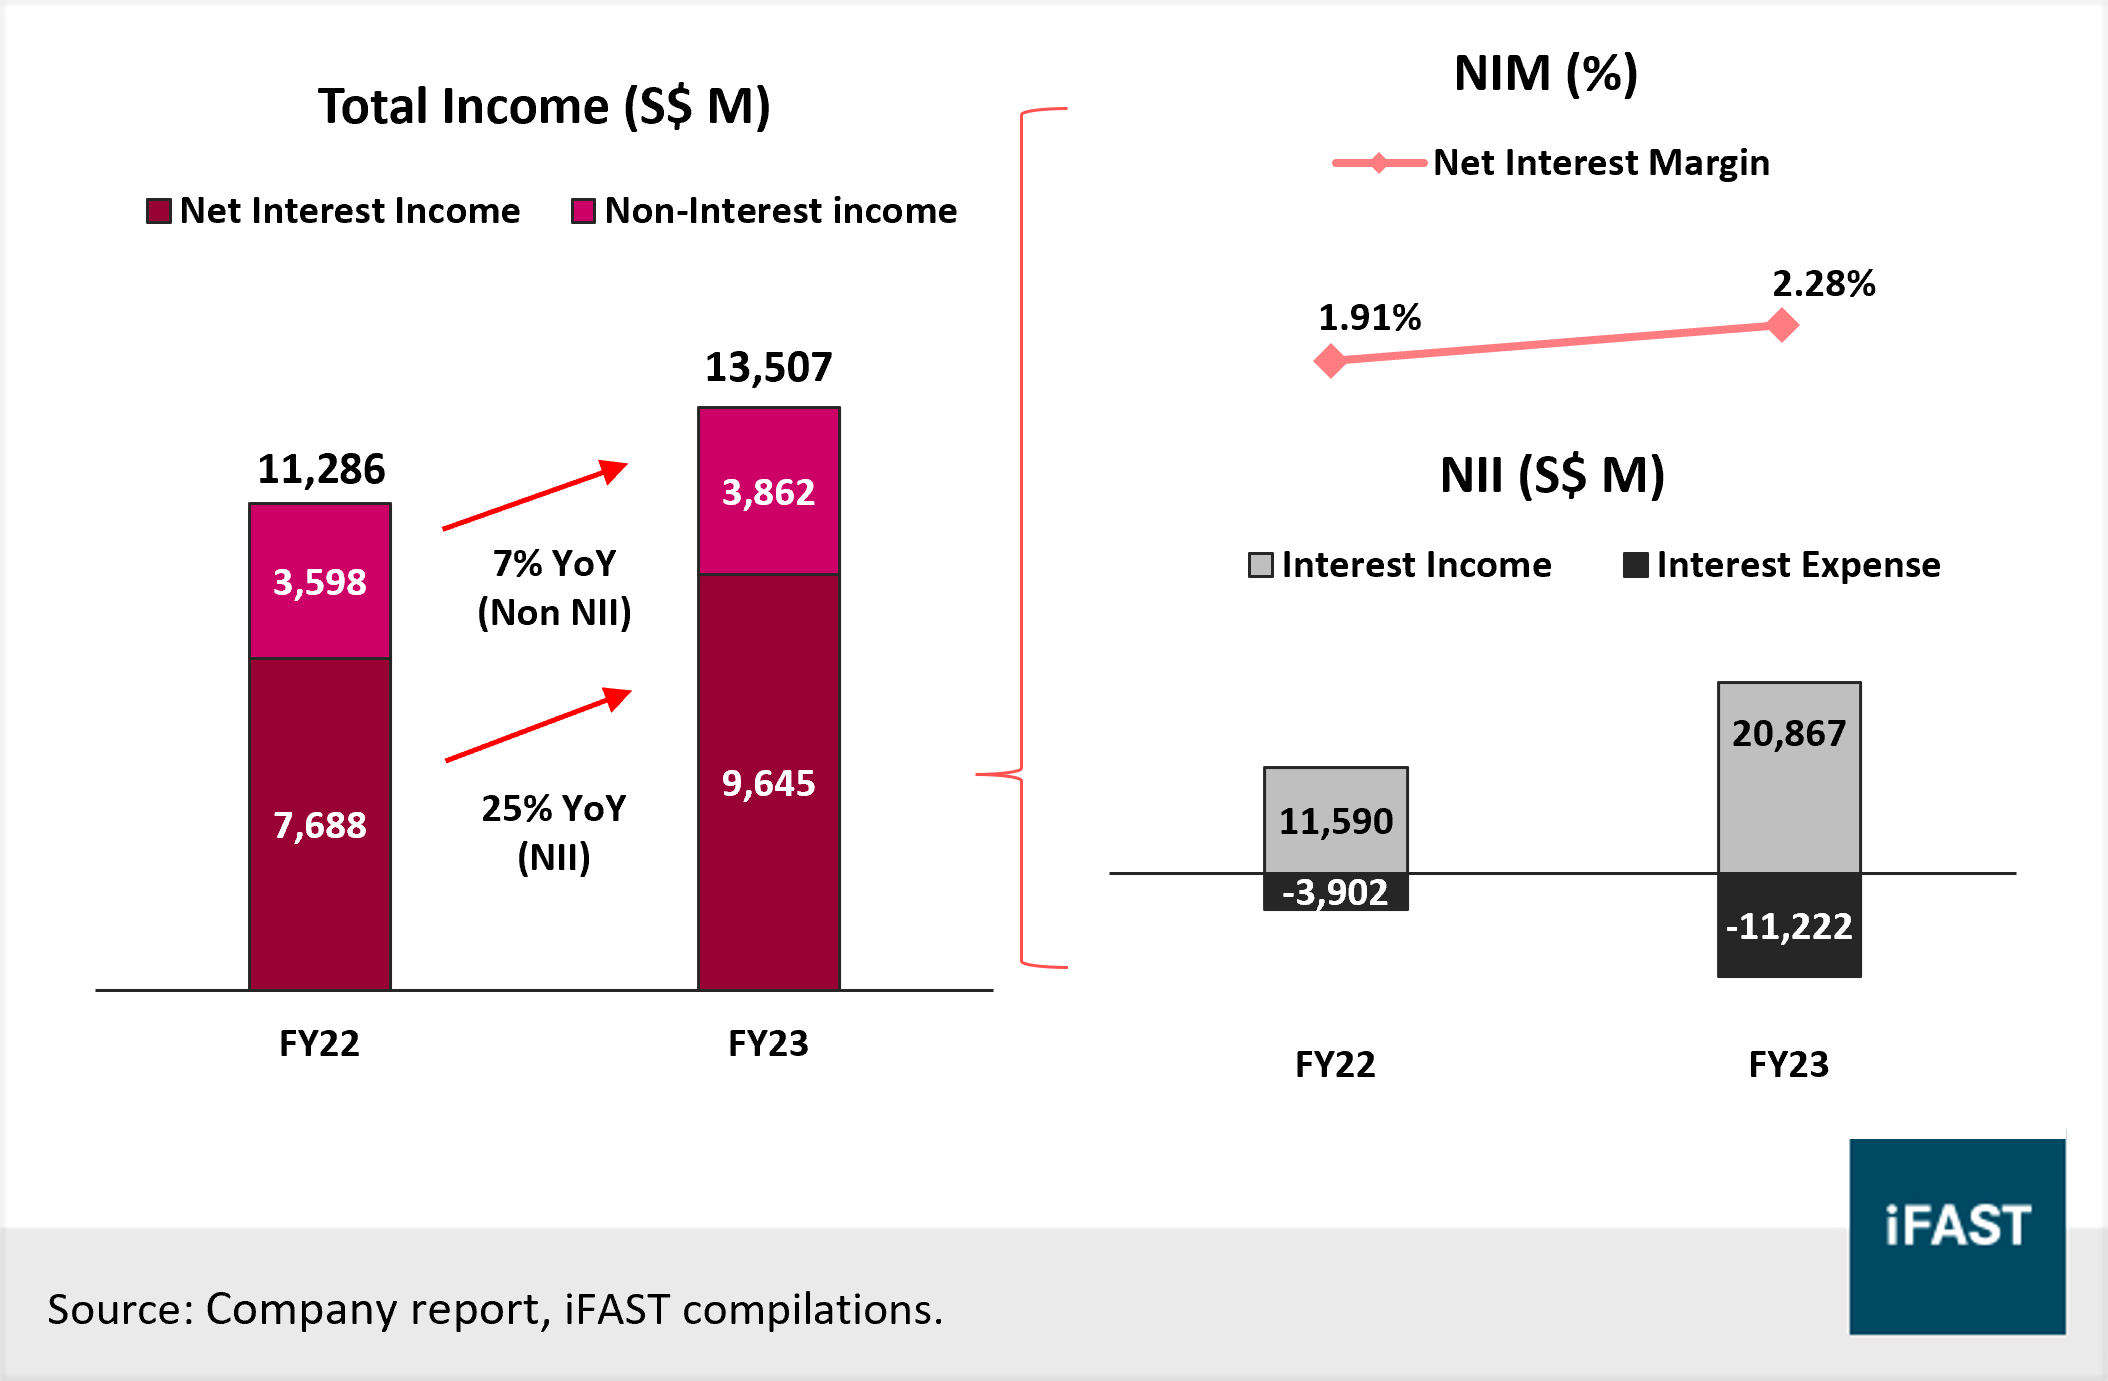
For the full year ended 31 December (“FY23”), OCBC recorded a 20% year-on-year (“YoY”) increase in total income from S$11,286M (FY22) to S$13,507M (FY23). The strong double-digit growth was fueled by a record high net interest income (“NII”) which grew 25% YoY, helped by a 37bps jump in net interest margins from 1.91% (FY22) to 2.28% (FY23). Meanwhile, non-interest income grew by a smaller 7% YoY, helped by improvements in trading income.
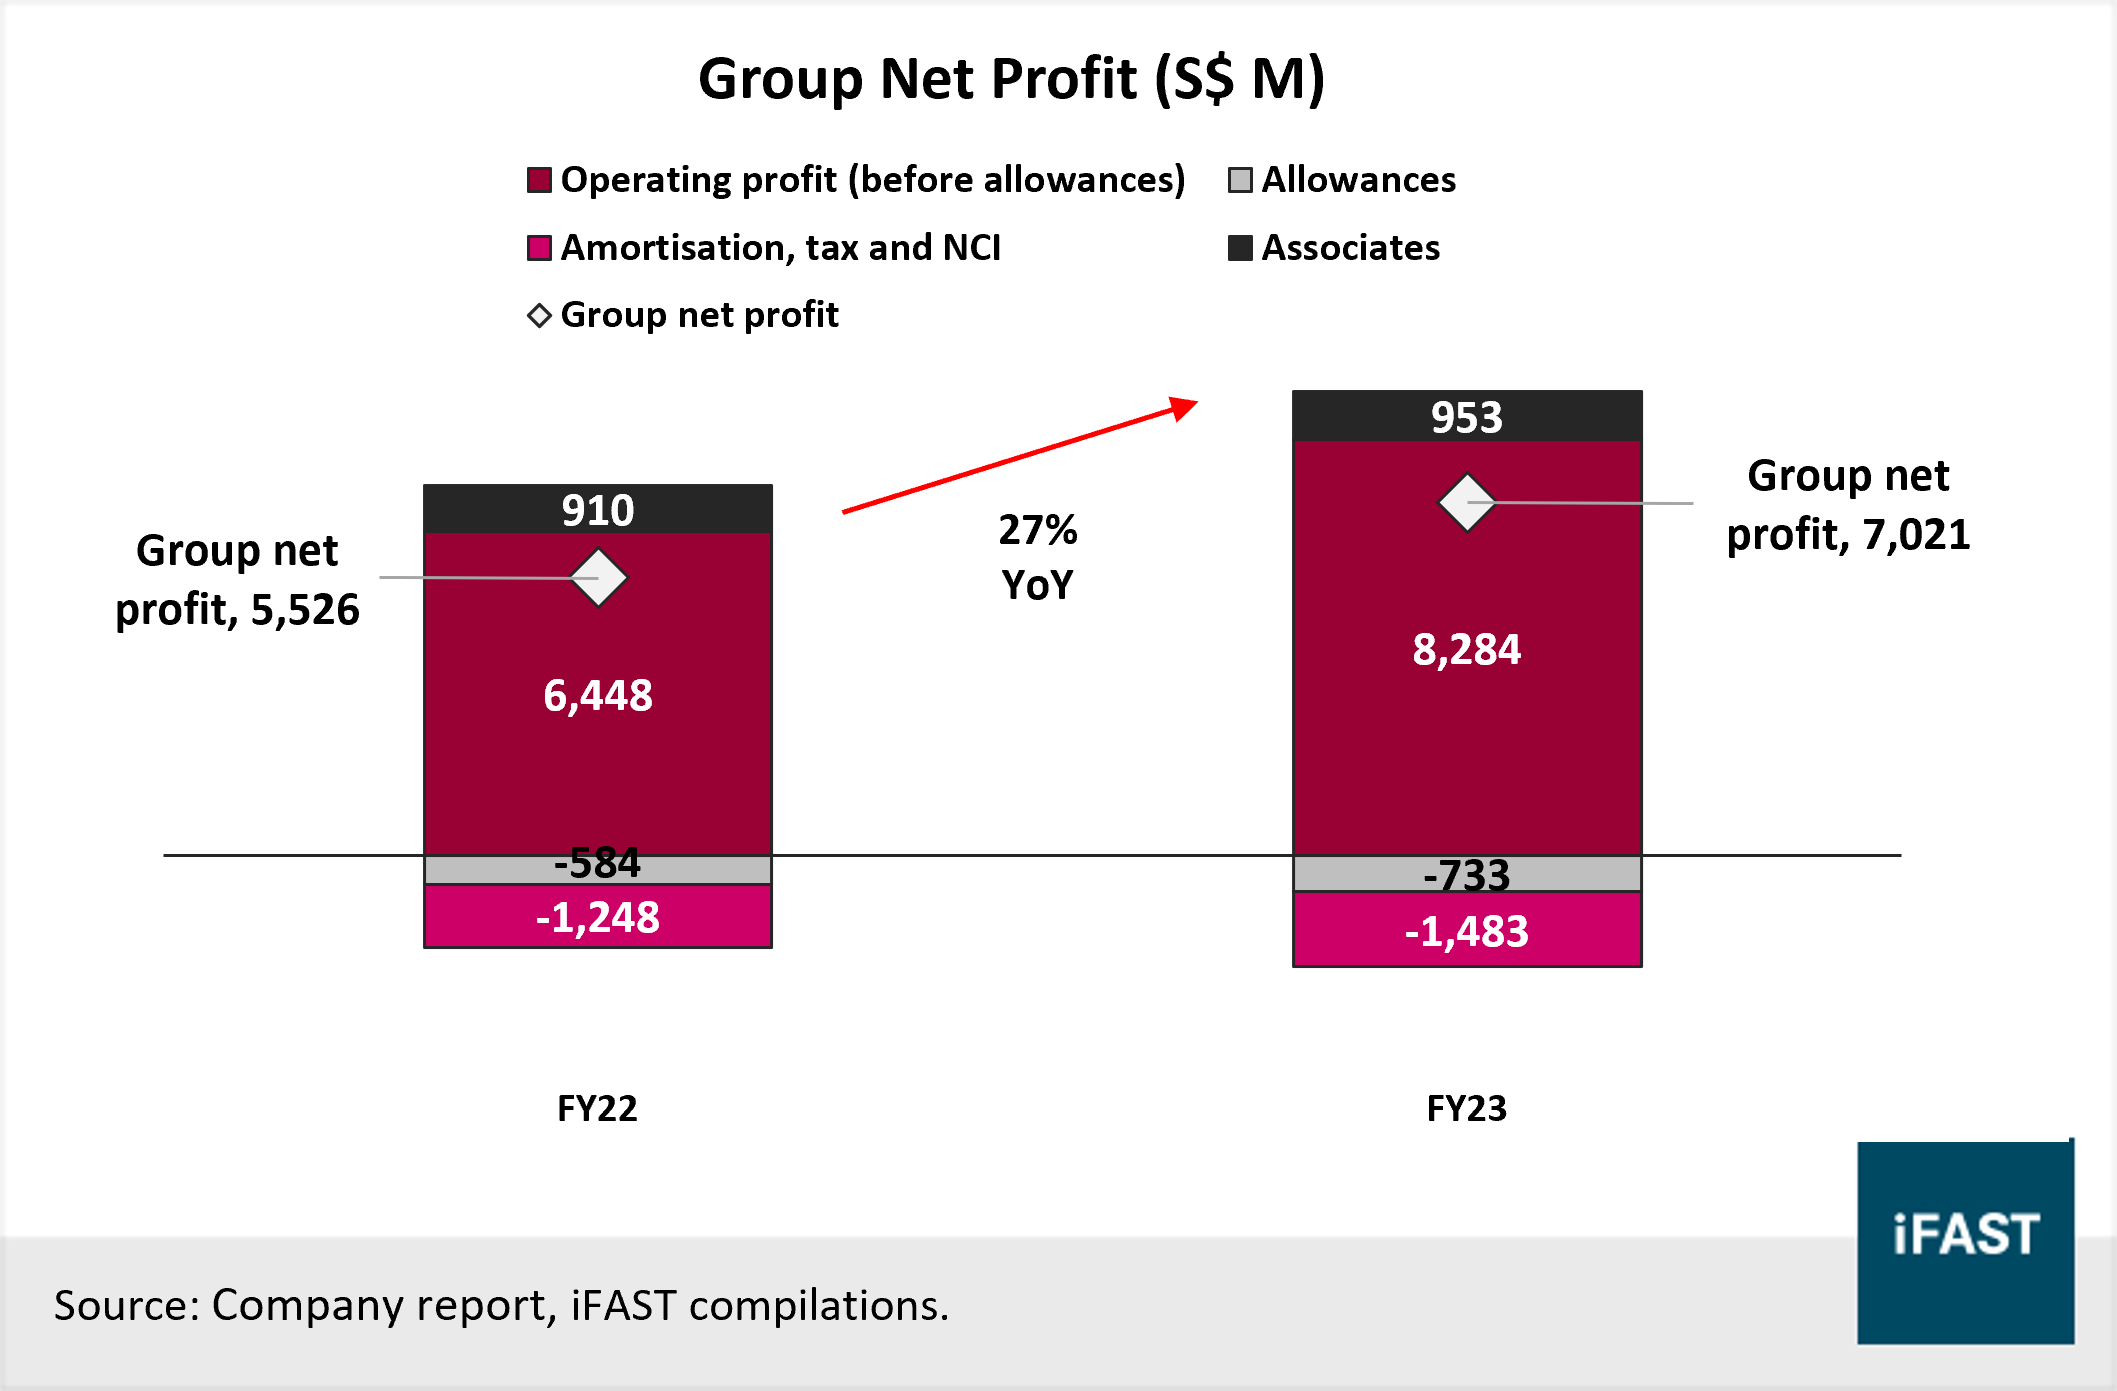
OCBC recorded a 28% YoY growth in operating profit (before allowances) from S$6,448M (FY22) to S$8,284M (FY23) due to the strong total income growth which offset an 8% YoY increase in operating expenses. Despite higher expenses, management has maintained cost discipline, and in conjunction with higher total income, lowered the cost-to-income ratio from 42.9% (FY22) to 38.7% (FY23). Overall, the Group recorded a 27% YoY increase in net profit to S$7,021M in FY23 from S$5,526M due to the strong operating profit, even as total allowances rose by 25% YoY from S$ 584M (FY22) to S$733M (FY23).
Chart 1: Total income grew by 20% YoY supported by strong growth in net interest income
Chart 2: Group net profit rose 27% YoY to a record S$7.02B despite higher allowances
By segment, OCBC’s Global Wholesale Banking remained the key revenue driver, contributing 46% of the total income. The segment saw a 32% YoY growth in total income led by strong NII growth and higher income from investment banking activities. The growing Global Consumer/ Private Banking segment was another major revenue driver, contributing 38% of the total income. The segment enjoyed an equally strong 31% YoY growth in total income as higher benchmark rates bolstered NII growth.
We remain positive on OCBC’s earnings outlook. We expect NIM to remain elevated in line with our house view of no Fed rate cuts in 2024 as front-end rates are likely to remain high, supporting NIM. At the same time, management has also guided NIM to be in the range of 2.20% to 2.25%, based even on multiple cuts in 2H24. This range is high relative to history, but based on our view on rates and the macro backdrop, we see scope for higher NIM than the range of 2.20% to 2.25%. While management has also guided for a low single-digit loan growth, we think higher NIM and consequently higher NII may offset this, especially in a soft landing where economic activities recover.
Broadly, our positive view is also bolstered by OCBC’s push for faster growth in ASEAN and Greater China. The Group is also aiming for S$3.0B incremental revenue from 2023 to 2025. This was an initiative launched last year and focuses on 1) capturing rising Asian wealth, 2) increasing ASEAN-Greater China trade and investment flows, 3) new economy and high-growth industries, and 4) sustainable financing.
Credit highlights
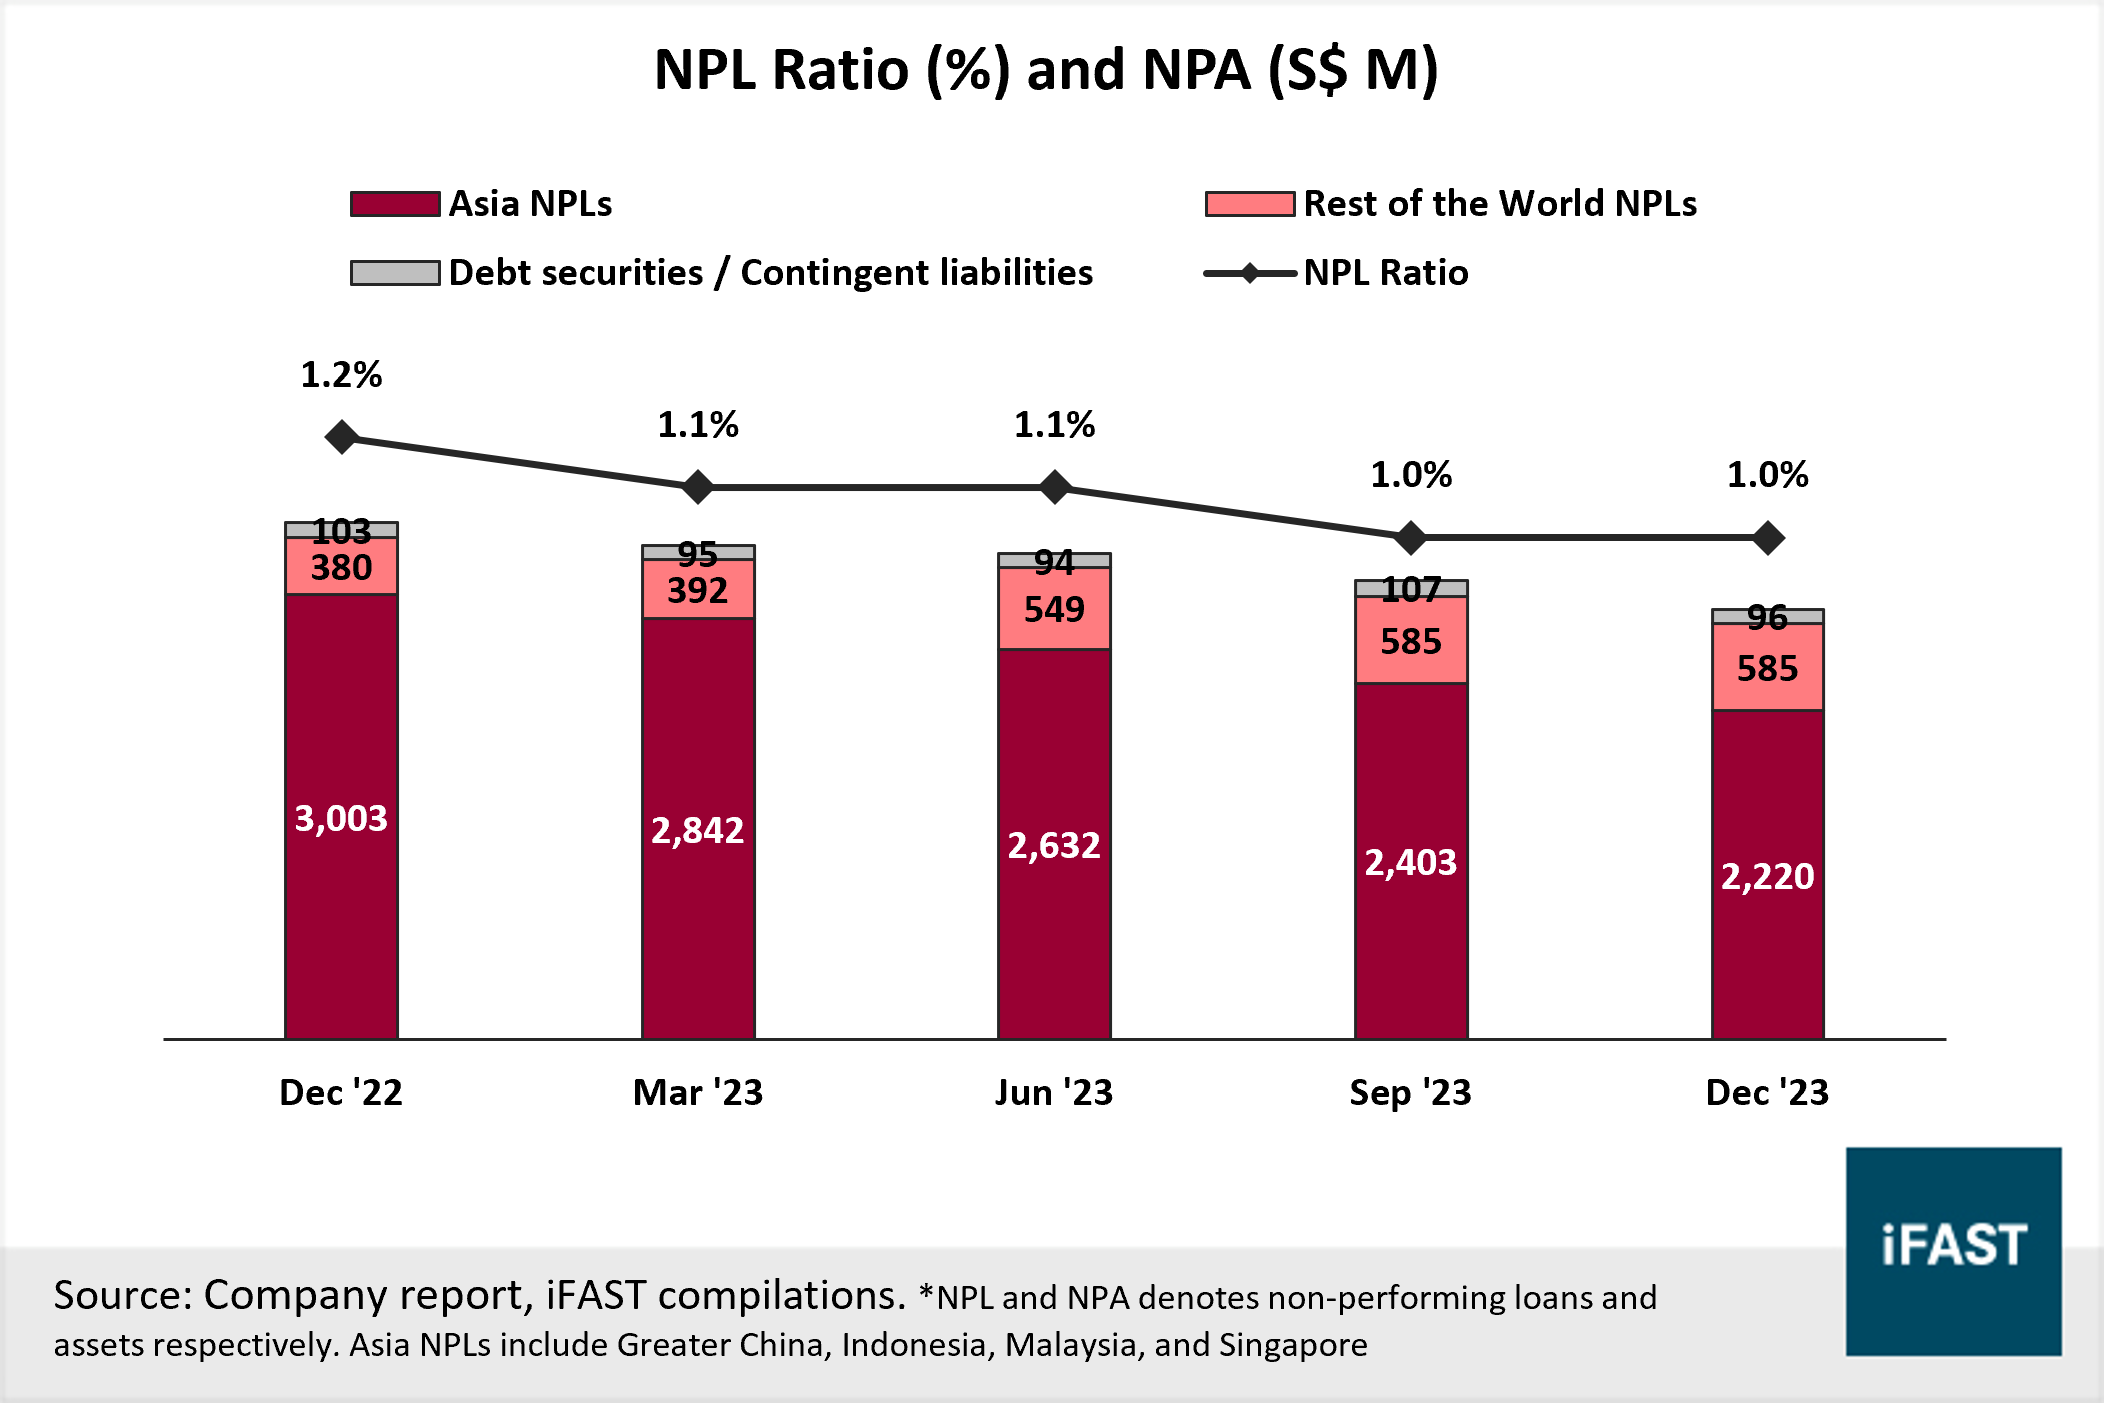
Asset quality for OCBC remains stable and resilient. As of end-December 2023, the non-performing loans ratio (“NPL”) held steady at 1.0%, unchanged since end-September and -0.2 percentage points lower YoY. NPL ratio has been on a downtrend over the past two years, back to pre-pandemic levels. It is also reassuring to see a 17% YoY drop in non-performing assets (“NPA”) relative to last year. As compared to December 2022, NPA rose across the rest of the world but greatly fell across Asia which the Group has a large exposure to. NPA in Greater China, an area of our concern, also fell YoY.
Greater coverage for non-performing assets and larger provision for risk situations. OCBC raised the provision set aside for non-impaired assets from S$ 368M (FY22) to S$ 400M (FY23) for macro-economic risks, changes in risk profiles and management overlays. Meanwhile, cumulative allowances for impaired assets rose by 10% YoY to S$ 4,382M which helped improve the NPA coverage ratio from 114% (Dec ’22) to 151% (Dec ’23).
Chart 3: NPL ratio held steady while NPA declined in FY23
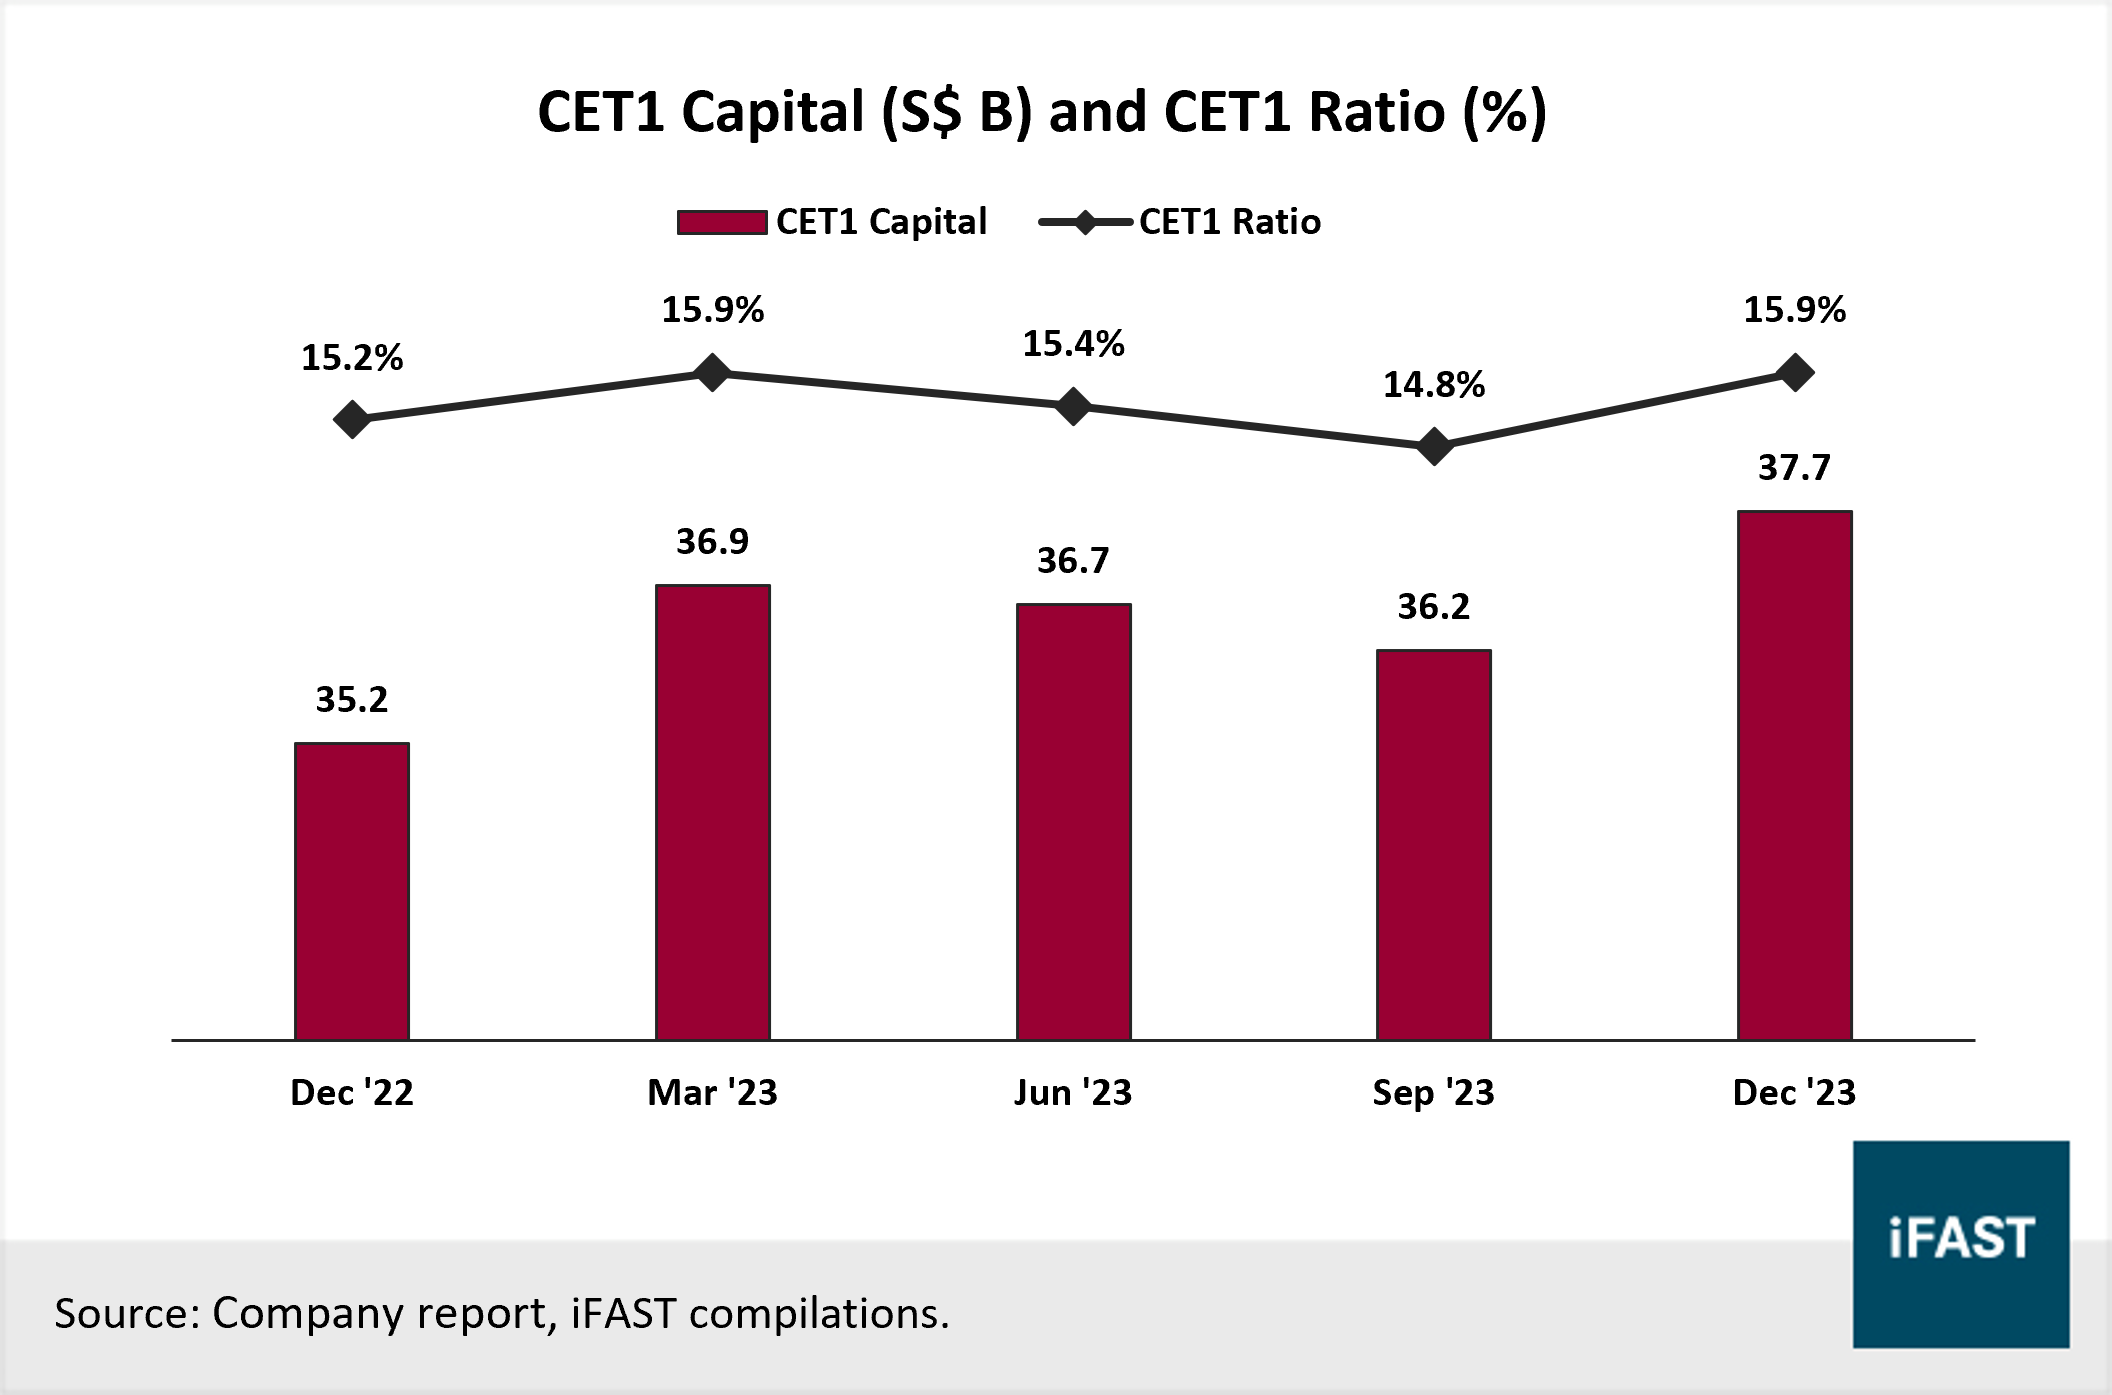
OCBC remains well-capitalised with a substantial buffer over the regulatory minimum. The Group’s CET1 ratio sits at a comfortable 15.9% as of 31 December 2023, substantially above the regulatory minimum of 6.5%. CET1 ratio rose by 1.1 percentage points, up from the 14.8% recorded a quarter ago. This was due to an increase in CET1 capital, following stronger profits, while risk-weighted assets fell. After adjusting for FY23 final dividend, OCBC’s CET1 ratio still remains high at 15.1%.
OCBC also has a strong liquidity profile and stable funding base. The Group’s all-currency liquidity coverage ratio (“LCR”), net stable funding ratio (“NSFR”) and leverage ratio stand at 155%, 116%, and 7.2% respectively as of 31 December 2023. All ratios continue to remain well above the regulatory minimum. OCBC also reported that customer deposits make up around 80% of its total funding. A higher composition often suggests a stable funding base as customer deposits tend to be more stable and stickier.
Chart 4: CET1 ratio remains at a comfortable 15.9% following a rise in CET1 capital
Recommendations
Table 1: USD tier 2 issuances from OCBC, DBS, UOB
Overall, the credit profile of OCBC remains stable and healthy with a positive earnings outlook supporting the Group. Amongst the Group’s USD issuances (Table 1), we prefer the tier 2 (“T2”)
OCBCSP 1.832% 10Sep2030 Corp (USD) for its attractive indicative yield (to call and maturity) given shorter years to call and maturity.
Relative to USD bonds from other major Singapore banks that have similar years to call/ maturity (Table 1), we think OCBC’s 2030 bond is also attractively priced and has the highest yield amongst peers. With a credit spread of 87bps (G-spread to call) and 151bps (G-spread to maturity), the highest amongst the peers, we think the bond’s valuation looks attractive and the spread has room to tighten. These bonds have similar credit ratings of “BBB+” by S&P and “A” by Fitch (DBS’ 2031 bond is unrated by S&P).
Under Basel III regulations, T2 issuances that remain uncalled past the first reset date will have to be amortized in the balance sheet of the company which weighs on the bank’s Tier 2 capital. This provides economic incentive for the bank to call and refinance to support their Tier 2 capital levels. In the event of a non-call, investors would still benefit from a relatively higher reset rate from OCBC’s 2030 bond given a larger initial spread (1.580%).
Declaration: For specific disclosure, at the time of publication of this report, IFPL (via its connected and associated entities) and the analyst who produced this report holds a NIL position in the abovementioned securities.
Our podcast series, Yield Hunters, is available on Spotify, iTunes Podcasts and Google Podcasts. We share our thoughts on new bond issues and hold discussions on the fixed income space. Listen to our latest episode below and follow us!